
Introduction: When Risk Becomes Return
The calculus of real estate investing shifted permanently in January 2025, when the Eaton and Palisades fires erased over $250 billion in Los Angeles property value. Insurance carriers pulled coverage. Lenders tightened terms. Buyers demanded steep discounts. Within weeks, properties that seemed conservatively underwritten revealed themselves as structurally impaired.
This wasn't an isolated event. First Street Foundation's February 2025 analysis projects that climate change will eliminate $1.47 trillion in U.S. residential real estate value over the next three decades. The mechanism is straightforward: rising insurance premiums, increasing physical damage risk, and shifting buyer preferences are creating a feedback loop that compounds value destruction in vulnerable markets while amplifying returns in climate-resilient assets.
For institutional operators, this creates a decisive moment. The sponsors who treat climate adaptation and ESG integration as compliance exercises will watch their portfolios erode. Those who underwrite resilience as a value multiplier (engineering specific, measurable interventions that protect NOI, compress cap rates, and unlock financing advantages) will capture asymmetric returns that compound across hold periods.
The question is no longer whether to underwrite for climate adaptation. It's how to do it with the same rigor you apply to rent comps and expense ratios.
The New Underwriting Paradigm: From Binary to Gradient
Traditional real estate underwriting operates in a binary framework. You model rents, expenses, debt service, and exit cap rates. The asset either clears your return hurdle or it doesn't. Climate and ESG adaptation forces a more sophisticated approach: gradient underwriting, where resilience attributes create measurable deltas across multiple return vectors simultaneously.
Consider a 200-unit multifamily property in a Sun Belt market. Under conventional underwriting, you project 4.5% stabilized cash-on-cash returns and an 11% IRR based on market rent growth, operational efficiency, and a conservative exit assumption. Now layer in climate adaptation underwriting:
Physical Risk Assessment: FEMA flood maps show 100-year flood exposure. Your insurance broker confirms premiums will increase 35% at renewal. Without flood mitigation, this expense spike compresses NOI by 2.8%, effectively transferring $140,000 annually from equity returns to risk premiums.
Adaptation Capital Deployment: You engineer $850,000 in resilience CapEx. Enhanced drainage systems, flood barriers, and backup power infrastructure comprise the investment. This investment reduces insurance premiums by 18%, cuts weather-related maintenance by $45,000 annually, and positions the asset for green financing at 25 basis points below market rates.
Value Creation Mechanics: The adaptation spend generates three distinct return streams. First, preserved NOI from insurance savings and reduced damage claims. Second, improved debt terms delivering $38,000 in annual interest savings. Third, cap rate compression of 15-20 basis points at exit due to demonstrable resilience, worth approximately $1.2 million in terminal value on a $32 million asset.
The math changes. Your all-in return isn't 11%. It's 12.3%, with materially lower volatility because you've converted an exposure into a moat.
The Three-Tier Climate Adaptation Framework
Institutional operators are converging on a three-tier approach to climate adaptation underwriting. Each tier addresses different aspects of risk while creating distinct value capture mechanisms.
Tier One: Physical Resilience as NOI Protection
The foundation layer focuses on tangible interventions that protect cash flow from physical climate events. These are the most straightforward to model because they map directly to operating statements.
Storm Hardening: Impact-resistant roofing, reinforced windows, and structural upgrades reduce repair costs while lowering insurance premiums. A 2025 study by Avison Young found that multifamily properties with verified storm hardening achieved insurance premium reductions of 12-22%, delivering 3-year payback periods on resilience investments.
Water Management Systems: Advanced drainage, permeable surfaces, and retention systems prevent flood damage. Properties in high-precipitation markets implementing comprehensive water management see maintenance cost reductions of $18-$35 per unit annually while protecting against six-figure emergency repairs.
Backup Infrastructure: Generator capacity, redundant HVAC systems, and emergency communications protect against revenue interruption during extreme weather events. The cost to deploy is $2,200 to $3,500 per unit. The avoided cost of even a single extended power outage (lost rents, damaged appliances, tenant turnover) typically justifies the investment within 18 months.
The underwriting discipline here is conservative haircuts on projected savings until third-party verification validates performance. Model 60% of projected insurance savings in your base case. The remaining 40% represents upside optionality if savings exceed projections.

Tier Two: Energy Efficiency as Margin Expansion
Beyond physical protection, energy efficiency creates compounding value through both expense reduction and financing advantages. This is where ESG adaptation transitions from defensive to offensive capital deployment.
Operational Savings: Energy-efficient HVAC systems, LED lighting, and building envelope improvements reduce utility costs. California's Low-Income Weatherization Program documented 47% average energy consumption reductions across multifamily properties, translating to 30% resident utility bill savings. For properties with owner-paid utilities, this flows directly to NOI.
Green Financing Access: Fannie Mae's Green Rewards program and Freddie Mac's Green Advantage products offer 10-25 basis point pricing reductions for properties meeting energy efficiency thresholds. On a $25 million loan, that's $25,000 to $62,500 in annual interest savings. This represents pure margin expansion requiring zero additional asset management lift.
Tenant Value Proposition: Energy-efficient units command rent premiums. CBRE's 2025 research confirms that multifamily properties with verified green certifications achieve 3.7% rent premiums over comparable non-certified assets. That premium compounds: on a $1,800 monthly rent, you're capturing an additional $67 per unit monthly, or $160,800 annually on a 200-unit property.
The modeling approach: underwrite energy savings at 70% of engineering estimates to account for behavior variance and system degradation. Price rent premiums conservatively at 2% rather than the full 3.7% until you validate tenant willingness to pay in your specific submarket.
Tier Three: Certification and Signaling as Exit Multipliers
The least understood but potentially most valuable tier involves formal certification and third-party validation. This is where climate adaptation becomes a cap rate compression tool.
LEED and ENERGY STAR: Properties with LEED certification demonstrate 10-21% market value premiums over non-certified comparables, according to EY's 2025 analysis. The mechanism isn't just operational performance. It's buyer pool expansion. Institutional buyers with ESG mandates can only acquire certified assets, creating scarcity value in supply-constrained markets.
GRESB Scores: For portfolio-level operators, Global Real Estate Sustainability Benchmark (GRESB) scores have become table stakes for institutional capital access. Properties contributing to strong portfolio GRESB performance trade at meaningful premiums. JLL data indicates that 50% of UK institutional investors now prioritize ESG criteria in acquisition decisions. This represents a threshold that fundamentally alters exit liquidity.
Climate Risk Disclosure: Properties with documented climate risk assessments and adaptation plans avoid "brown discounts." Savills' 2025 research confirms that assets without climate resilience planning face valuation haircuts of 8-15% in high-risk markets as buyers price in future adaptation costs and stranding risk.
The exit modeling becomes critical here. A 15-basis point cap rate compression on a $32 million asset at a 5.5% exit cap represents $873,000 in additional terminal value. Subtract $200,000 in certification costs and ongoing compliance, and you're still capturing $673,000 in pure value creation from signaling and market positioning.
Sample Pro Forma: Base vs. Climate-Adapted Underwriting
Let's work through a specific example that demonstrates how these adaptation investments flow through a pro forma. Consider a 200-unit multifamily property in Nashville. This market faces increasing storm frequency and flood risk but maintains strong demographic fundamentals.
Base Case Assumptions:
- Purchase Price: $32,000,000 (effectively $160,000 per unit)
- Year 1 NOI: $1,920,000
- Stabilized Cash-on-Cash: 4.5%
- 10-Year Hold IRR: 11.2%
- Exit Cap Rate: 5.5%
Climate-Adapted Case:
Additional CapEx Investment: $950,000 (deployed Year 1)
- Storm hardening and roof upgrades: $425,000
- Stormwater management systems: $285,000
- Energy efficiency retrofit: $180,000
- LEED certification and commissioning: $60,000
Operating Impact (Stabilized Year 3):
- Insurance premium reduction: $52,000 annually (18% reduction from $289,000 baseline)
- Energy cost savings: $38,400 annually (assuming 40% owner-paid utilities at $96,000 baseline)
- Maintenance cost reduction: $24,000 annually (weather-related repairs)
- Green financing advantage: $32,000 annually (20 bps on $16M in debt)
Total Annual NOI Improvement: $146,400
Revenue Enhancement:
- Rent premium (2% on $1,800 avg rent): $86,400 annually
- Improved occupancy (50 bps improvement from 94% to 94.5%): $21,600 annually
Combined NOI Uplift: $254,400 annually once stabilized
Exit Value Impact:
- Base case exit (Year 10): $34,909,091 (at 5.5% cap)
- Adapted case exit: $39,527,273 (at 5.25% cap, reflecting 25 bps compression)
- Exit value premium: $4,618,182
Return Comparison:
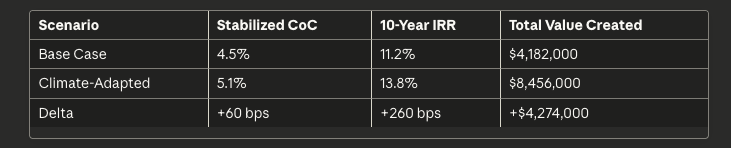
The climate-adapted scenario delivers 260 basis points of IRR expansion while creating over $4.2 million in incremental value. The additional equity required for adaptation CapEx ($950,000) returns better than 4.5x over the hold period when accounting for operational improvements, financing advantages, and exit value preservation.
Sensitivity Analysis: What Actually Moves the Needle
Not all climate adaptation investments deliver equal returns. Sophisticated sponsors run sensitivity analysis to identify which variables drive the most material outcomes.
Primary Value Drivers (ranked by IRR sensitivity):
- Exit Cap Rate Compression (50-100 bps impact potential): The single largest value driver. Even 15 basis points of cap rate benefit at exit creates $873,000 in terminal value on a $32 million asset. This is where certification, third-party validation, and climate risk documentation matter most.
- Insurance Cost Management (15-35% premium reduction potential): Insurance costs are rising faster than mortgage payments in high-risk markets. Properties in the top quartile for insurance cost management are capturing 200-300 basis points of NOI advantage over comparable assets without resilience features.
- Green Financing Access (10-30 bps pricing improvement): Agency green debt programs deliver immediate value through reduced debt service. The advantage compounds: better debt terms improve cash-on-cash returns while preserving more equity value at refinancing.
- Operational Efficiency (2-8% NOI improvement): Energy and maintenance savings create steady, recurring value. While individually modest, these improvements compound annually and flow entirely to NOI with no additional asset management burden.
- Rent Premium Capture (0-5% premium potential): The most market-dependent variable. Premium capture requires tenant education and varies significantly by demographics, income levels, and ESG awareness in specific submarkets.
Stress Test Scenarios:
Prudent underwriting requires modeling downside cases where adaptation investments underperform:
Pessimistic Case: Insurance savings materialize at only 60% of projection, no rent premium capture, exit cap rate holds flat at 5.5%. Result: 11.7% IRR. This still delivers 50 basis points above base case, validating downside protection even when upside doesn't fully materialize.
Moderate Case: Insurance and energy savings at 80% of projection, 1% rent premium, 10 basis points of cap rate compression. Result: 12.4% IRR. This represents 120 basis points above base case with modest execution risk.
Optimistic Case: Full realization of operational savings, 3% rent premium, 25 basis points cap rate compression. Result: 13.8% IRR. This delivers 260 basis points above base case.
The range of outcomes (11.7% to 13.8%) is narrow compared to the downside protection achieved. Even in the pessimistic scenario, you're preserving value and generating incremental returns. This asymmetry (limited downside, meaningful upside) is the signature of intelligent capital deployment.
Implementation: The Operational Reality
Theory meets execution in asset management. Climate adaptation underwriting only creates value if your operations team can actually deploy and manage the interventions. Here's the implementation framework that separates aspirational underwriting from realized returns.
Phase One: Pre-Acquisition Due Diligence (30-45 days)
Climate risk assessment becomes as critical as Phase I environmental reports. Deploy third-party climate risk modeling (Climate X, First Street Foundation, or similar platforms) to quantify exposure. You're measuring:
- Physical damage probability across flood, wind, wildfire, and extreme heat scenarios
- Insurance availability and projected premium escalation
- Utility infrastructure resilience
- Regulatory risk from climate-related building codes
This assessment informs your basis. If a property requires $1.2 million in adaptation CapEx but the seller hasn't disclosed flood exposure, you're negotiating a price reduction or walking. Value creation begins at acquisition.
Phase Two: Capital Deployment (Months 1-18)
Sequence matters. Storm hardening and water management deploy first—these are NOI protection, not enhancement. Energy efficiency follows once physical resilience is established. Certification comes last, after operational baselines are proven.
Budget 15-20% contingency on climate CapEx. These projects encounter unforeseen conditions more frequently than cosmetic renovations. Drainage systems reveal foundation issues. Storm hardening exposes roof damage. Contingency is cost of knowledge, not waste.
Phase Three: Performance Validation (Months 12-36)
Third-party verification converts claims into credentials. Commission LEED assessment, engage ENERGY STAR certification, document insurance premium reductions. This validation phase creates the exit value through credibility.
Track granular metrics: energy consumption per unit per month, weather-related maintenance tickets, insurance claims frequency, tenant satisfaction scores. These become your marketing assets when positioning for refinance or sale.
Phase Four: Refinance Optionality (Months 24-48)
The adaptation investments create refinance optionality that traditional value-add doesn't. Banks underwrite lower risk when resilience is documented. You're accessing better terms while pulling more equity out.
On that $32 million property, improved NOI from adaptation might support refinancing at 70% LTV instead of 65%, extracting an additional $1.6 million while maintaining conservative leverage. That's equity returned to LPs while the asset continues performing—the holy grail of value-add investing.

The LP Diligence Lens: What Allocators Actually Evaluate
Understanding how institutional LPs evaluate climate-adapted deals changes how you present them. LPs aren't impressed by ESG narratives—they're analyzing whether you've converted adaptation into modeled cash flows.
Primary LP Due Diligence Questions:
1. "How did you quantify climate risk in your basis adjustment?" LPs want to see that you priced the risk before acquisition. Show your climate risk modeling, third-party reports, and how projected adaptation costs influenced your purchase price negotiations.
2. "What haircuts did you apply to projected savings?" This reveals your underwriting discipline. Conservative haircuts (60-70% of engineering projections) signal sophistication. Assuming 100% realization signals inexperience or optimism bias.
3. "How do you plan to validate performance?" Third-party certification isn't optional—it's table stakes. LPs discount self-reported performance. Independent verification through LEED, ENERGY STAR, or engineering firms creates credibility.
4. "What's your exit strategy if green premiums don't materialize?" This tests whether you've built genuine downside protection or simply underwrote speculative upside. Strong answers demonstrate that operational savings alone justify adaptation investments, making exit premiums pure optionality.
5. "How does this fit within portfolio-level ESG reporting?" Increasingly, LPs have their own ESG reporting obligations to their LPs. Properties that contribute to portfolio GRESB scores and facilitate SEC climate disclosure compliance are more valuable than standalone assets with strong individual performance.
The sophisticated LP presentation integrates climate adaptation into your standard investment memo structure. It's not a separate ESG appendix—it's embedded in your underwriting assumptions, capital deployment schedule, and return sensitivity analysis.
Avoiding the Greenwashing Trap
The line between climate adaptation as value creation and greenwashing as value destruction is clear: modeled cash flows with third-party validation versus aspirational claims without operational substance.
Red Flags That Signal Greenwashing:
- Claiming ESG benefits without quantifying NOI impact
- Referencing sustainability without third-party certification
- Assuming rent premiums without comparable property evidence
- Failing to haircut projected savings
- Neglecting to model adaptation CapEx in your basis
- Presenting climate benefits in qualitative rather than quantitative terms
Green Flags That Signal Legitimate Value Creation:
- Conservative underwriting with sensitivity analysis showing positive returns across multiple scenarios
- Granular CapEx budgets with line-item adaptation costs
- Third-party climate risk assessments informing acquisition decisions
- Documentation of insurance premium reductions and green financing terms
- Comparable property analysis validating rent premiums in specific submarkets
- Performance monitoring systems tracking actual vs. projected savings
The difference is execution discipline. Greenwashing is cheap talk. Genuine climate adaptation is expensive capital deployment that generates measurable returns. When your LP asks to see utility bills, insurance policies, and engineering reports, you're prepared. When they audit your NOI claims against actual operating statements, the numbers validate your underwriting.
The Competitive Moat: Why Early Adopters Capture Disproportionate Value
Markets reward pioneers, then commoditize advantages. Climate adaptation underwriting currently offers asymmetric returns because the vast majority of sponsors haven't integrated it into their acquisition process. This window is time-bound.
First-Mover Advantages (2025-2028):
Capital Access: Institutional LPs with ESG mandates are capital-rich but deal-flow constrained. Sponsors demonstrating sophisticated climate underwriting capture allocation preferentially. Family offices increasingly screen for climate risk management before committing to GP relationships.
Acquisition Advantage: Sellers haven't universally adjusted pricing for climate risk. The spread between what an informed buyer can model (incorporating adaptation CapEx and resulting value creation) and what sellers are asking creates deal opportunities. This mispricing window closes as climate risk becomes standard diligence.
Financing Terms: Agency lenders and commercial banks are competing on green lending. Early adopters access preferential terms before these become commoditized into standard pricing. The 20-30 basis point advantage you capture today may only be 5-10 basis points in three years as green debt becomes baseline expectation.
Exit Liquidity: Currently, climate-adapted properties trade to a narrow buyer universe of sophisticated institutionals. As more buyers integrate climate diligence, this scarcity premium expands liquidity rather than compressing it. You're building tomorrow's buyer pool by validating today's underwriting approach.
Competitive Disadvantage of Inaction:
The inverse matters more. Sponsors who ignore climate adaptation aren't maintaining status quo—they're accumulating technical debt. Their properties will require capital to achieve market-standard resilience. But they'll deploy that capital defensively, under duress, in response to insurance non-renewals or buyer objections, rather than strategically as value creation.
Properties without climate adaptation are becoming "brown assets"—trading at discounts that reflect buyer adjustments for future adaptation costs plus risk premiums for uncertainty. Savills documents 8-15% valuation haircuts in climate-exposed markets for assets without documented resilience planning.
FAQs
How much additional capital does climate adaptation require per unit?
It varies by asset condition, climate exposure, and target certification level. Storm hardening and basic energy efficiency typically requires $3,000-$6,000 per unit. Full LEED certification with comprehensive resilience features ranges $8,000-$15,000 per unit. The key is modeling this CapEx against projected returns—adaptation generating sub-10% returns on deployed capital typically doesn't meet hurdles. Target 15%+ returns on adaptation-specific CapEx to ensure it's accretive to overall deal returns.
Do climate adaptation investments extend hold periods?
Not necessarily—properly structured adaptation deploys in months 1-18 and generates cash flow improvements by year 3. This aligns with typical value-add timelines. The operational nature of climate adaptation (insurance savings, energy efficiency) creates immediate NOI impact, unlike market-dependent value creation requiring longer time horizons to materialize.
How do you underwrite climate risk in markets without significant historical extreme weather events?
Forward-looking climate modeling, not backward-looking historical data. Use platforms like Climate X or First Street Foundation that project 30-year climate scenarios using IPCC frameworks. The markets seeing the steepest value creation from adaptation aren't necessarily those with the worst historical climate exposure—they're markets where future projections show meaningful risk acceleration but current pricing hasn't adjusted.
What's the minimum property size where climate adaptation economics make sense?
Scale matters. Properties below 75-100 units struggle to justify the fixed costs of comprehensive resilience programs and certification. The operational overhead and third-party validation costs don't scale linearly down. Focus adaptation investments on larger assets (150+ units) or portfolios where you can amortize certification and consulting costs across multiple properties.
How do you handle climate adaptation in value-add deals with significant capital improvement budgets?
Integration, not addition. Climate adaptation shouldn't be a separate capital program—it should be embedded in your renovation strategy. When you're replacing HVAC systems, specify high-efficiency units. When you're re-roofing, implement storm hardening. When you're upgrading landscaping, integrate water management. The marginal cost of climate-adapted specifications over standard replacements is typically 8-15%, not 100%+.
Conclusion: The Unavoidable Opportunity
Climate change presents real estate investors with what BCG and Temasek call an "unavoidable opportunity"—a market shift so fundamental that inaction guarantees obsolescence while strategic response creates compounding advantages.
The $1.47 trillion in projected real estate value destruction isn't uniformly distributed. It concentrates in assets without resilience, owned by sponsors without foresight, financed by lenders without sophisticated risk management. The inverse represents an equivalent opportunity: value preservation and creation through disciplined climate adaptation underwriting.
This isn't about saving the planet through your investment portfolio—though that's a meaningful externality. It's about competitive advantage through operational discipline. The sponsors who engineer climate adaptation as a value multiplier, who convert ESG attributes into modeled cash flows, who protect NOI while expanding exit optionality, will capture disproportionate returns across this decade.
The underwriting framework is established. The operational playbook is validated. The capital is available, increasingly on preferential terms. What's required is execution: integrating climate risk into acquisition decisions, deploying adaptation capital strategically, validating performance through third-party certification, and positioning assets to capture value at refinancing and exit.
The window for asymmetric returns through climate adaptation underwriting is open but narrowing. Markets reward pioneers, then commoditize advantages. Five years from now, climate-adapted underwriting will be table stakes, not competitive advantage.
The question for sponsors and LPs is whether you're positioned to capture the value creation opportunity today, or whether you'll be deploying defensive capital tomorrow to achieve market baseline.
Subscribe for Institutional-Grade Insights
Join Carbon's private investor newsletter for monthly underwriting analysis, deal updates, and market intelligence at https://www.investwithcarbon.com/newsletter
Sources
First Street Foundation, "Climate Change Impact on U.S. Residential Real Estate," February 2025
EY Real Estate, "Looking at ESG's Positive Impact on Property Values," 2025
CBRE Research, "The Value of Sustainable Building Features," 2025
Avison Young, "Weatherproof Investments: The Case for Climate-Resilient Affordable Housing," 2025
JLL Global Research, "Value of Climate Risk: How Real Estate Owners Can Adapt," March 2025
McKinsey & Company, "Climate Resilience Technology: An Inflection Point for New Investment," September 2025
Boston Consulting Group & Temasek, "The Private Equity Opportunity in Climate Adaptation and Resilience," May 2025
World Resources Institute, "Strengthening the Investment Case for Climate Adaptation," June 2025
Savills Global Research, "Adaptation or Obsolescence: Real Estate on the Front Line of Climate Change," May 2025
GRESB, "Real Estate Assessment Report," 2024
Fannie Mae, "Green Rewards Program Guidelines," 2025
Freddie Mac, "Green Advantage Program Overview," 2025
National Centers for Environmental Information, "Billion-Dollar Weather and Climate Disasters Database," 2024-2025
Cushman & Wakefield, "Green Gains: Unlocking Commercial Real Estate Value Through Sustainability," November 2025
RICS, "Sustainability Report 2024"
Climate X, "Physical Climate Risk Data for Real Estate," 2025
UN Environment Programme, "Adaptation Gap Report 2024"
.svg)


